Introduction to PySpark Part 4 – Summarising Data
This is the fourth part in a series of blog posts as an introduction to PySpark.
The other parts of this blog post series can be found here:
- Part 1 – Creating Data Frames and Reading Data from Files
- Part 2 – Selecting, Filtering and Sorting Data
- Part 3 – Adding, Updating and Removing Columns
- Part 4 – Summarising Data
- Part 5 – Aggregating Data
In this part I’ll be covering:
- Summary Statistics (Describe)
- Getting Column max, min, mean, stdev
- Getting Column quantiles
- Counting Rows and Distinct values
Summary Statistics (Describe)
Similar to how in pandas we can use the describe method of a DataFrame, we can do a similar thing in PySpark.
Let’s read in our Pokemon dataset we’ve taken a look at previously:
pokemon = spark.read.parquet('/mnt/tmp/pokemon.parquet')
display(pokemon.limit(10))
| # | Name | Type1 | Type2 | HP | Attack | Defense | Sp.Atk | Sp.Def | Speed | Generation | Legendary |
|---|---|---|---|---|---|---|---|---|---|---|---|
| 1 | Bulbasaur | Grass | Poison | 45 | 49 | 49 | 65 | null | 45 | 1 | false |
| 2 | Ivysaur | Grass | Poison | 60 | 62 | 63 | 80 | 80.0 | 60 | 1 | false |
| 3 | Venusaur | Grass | Poison | 80 | 82 | 83 | 100 | 100.0 | 80 | 1 | false |
| 3 | VenusaurMega Venusaur | Grass | Poison | 80 | 100 | 123 | 122 | 120.0 | 80 | 1 | false |
| 4 | Charmander | Fire | null | 39 | 52 | 43 | 60 | 50.0 | 65 | 1 | false |
| 5 | Charmeleon | Fire | null | 58 | 64 | 58 | 80 | 65.0 | 80 | 1 | false |
| 6 | Charizard | Fire | Flying | 78 | 84 | 78 | 109 | 85.0 | 100 | 1 | false |
| 6 | CharizardMega Charizard X | Fire | Dragon | 78 | 130 | 111 | 130 | 85.0 | 100 | 1 | false |
| 6 | CharizardMega Charizard Y | Fire | Flying | 78 | 104 | 78 | 159 | 115.0 | 100 | 1 | false |
| 7 | Squirtle | Water | null | 44 | 48 | 65 | 50 | 64.0 | 43 | 1 | false |
We can summarise our columns using the describe method of the DataFrame.
We can see we have 800 records and that the HP of the Pokemon ranges from 1 to 255 and that the combat statistics for the Pokemon range from 5 to 230.
We can also tell that some of our Pokemon are missing Sp.Def values so we can fill these in with the minimum value (5)
display(pokemon.describe())
| summary | # | Name | Type1 | Type2 | HP | Attack | Defense | Sp.Atk | Sp.Def | Speed | Generation |
|---|---|---|---|---|---|---|---|---|---|---|---|
| count | 800 | 800 | 800 | 414 | 800 | 800 | 800 | 800 | 784 | 800 | 800 |
| mean | 362.81375 | null | null | null | 69.25875 | 79.00125 | 73.8425 | 72.82 | 71.9515306122449 | 68.2775 | 3.32375 |
| stddev | 208.34379756406656 | null | null | null | 25.534669032332076 | 32.45736586949845 | 31.183500559332924 | 32.7222941688016 | 27.999957994934416 | 29.060473717161447 | 1.6612904004849451 |
| min | 1 | Abomasnow | Bug | Bug | 1 | 5 | 5 | 10 | 20.0 | 5 | 1 |
| max | 721 | Zygarde50% Forme | Water | Water | 255 | 190 | 230 | 194 | 230.0 | 180 | 6 |
pokemon = pokemon.fillna(value=5, subset=["`Sp.Def`"])
Getting Column max, min, mean, stdev
Unlike in pandas, we can’t just call DataFrame.column.max() to get the maximum value of a column, we have to collect the values and index from this in order to get our summary statistics values.
Let’s take a look at a few examples:
from pyspark.sql.functions import max as col_max

# max
max_hp = pokemon.agg(col_max('HP').alias('max_hp')).collect()[0]['max_hp']
print(max_hp)
from pyspark.sql.functions import mean as col_mean

# mean
mean_hp = pokemon.agg(col_mean('HP').alias('mean_hp')).collect()[0]['mean_hp']
print(mean_hp)
from pyspark.sql.functions import min as col_min

# min
min_hp = pokemon.agg(col_min('HP').alias('min_hp')).collect()[0]['min_hp']
print(min_hp)
from pyspark.sql.functions import stddev

# std. dev
stddev_hp = pokemon.agg(stddev('HP').alias('stddev_hp')).collect()[0]['stddev_hp']
print(stddev_hp)
Getting Column quantiles
To retrieve quantiles from a column we can use the approxQuantile method
# 5%, Q1, Q2 (median), Q3, 95%
print(
    pokemon.approxQuantile('HP', [0.05, 0.25, 0.5, 0.75, 0.95], 0.01)
)
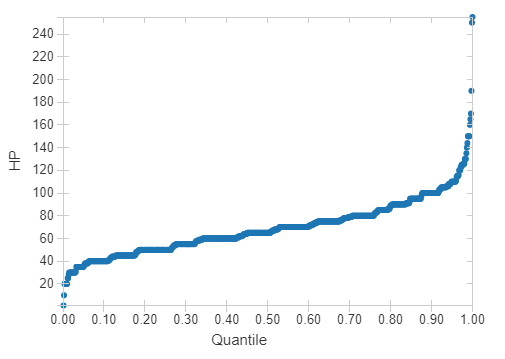
So although the maximum value of HP is 255, this is certainly an outlier and the vast majority of Pokemon have HP values less than 100. This can be confirmed by plotting a quantile plot.
display(pokemon.select('HP'))

Counting Rows and Distinct Values
Fortunately, for counting the number of rows of our DataFrame, we do have a count method.
print(pokemon.count())
We can also count the distinct number of rows, in this case all of our rows are distinct.
print(pokemon.distinct().count())
But if we subset it on our Pokemon number (#) to see how many pokemon we have that aren’t Mega evolutions, we get a fewer number of columns:
print(pokemon.select('#').distinct().count())
To retrieve the distinct values of a column, we can collect the distinct values in a list comprehension:
print(
    [row['Type1'] for row in pokemon.select('Type1').distinct().collect()]
)